
PTV Group develops mesoscopic rail passenger simulation tool in collaboration with Network Rail (UK)
Station capacity analysis tool using the mesoscopic simulation in PTV Visum adopted by Network Rail
London (UK), 12/10/2021. PTV software for mesoscopic simulation has been successfully implemented in a pedestrian context to analyse detailed passenger movements within rail stations. The new tool is a first-of-a-kind solution that leverages standard datasets for timetables, passenger estimates and station layouts to allow for a station model to be built, run, and analysed in a few hours.
Analysis of rail station capacity in the UK is usually undertaken using either very detailed microsimulation models, or simple high-level spreadsheet-based calculations driven by static throughput capacity principles. Network Rail required an intermediate solution where a model can be developed, and scenarios evaluated more quickly than with microsimulation but with sufficient detail to analyse different station layouts and evaluate possible interventions to manage capacity.
The tool has been developed around PTV Visum, utilising its data structures to store demand data such as matrices of passenger movements and run the simulation using the simulation-based assignment (SBA) method, before exporting a standard set of analyses such as passenger flows, platform densities and station clearance times. The mesoscopic approach allows for the modelling of individual passengers through a station layout, linking up walkways, stairs, platforms, and concourses. This allows for the analysis of key metrics such as queue length, walking speeds and levels of service throughout the station.
“The development of a bespoke mesoscopic station modelling tool within the Visum package has been a truly collaborative piece between PTV Group, RelativeGAP, and Network Rail. Having such a tool is a game changer for our analysis, not only allowing us to undertake advanced assessments much more quickly, but also in terms of transparency and governance, where the methodology is much more defined and controlled than previous spreadsheet modelling. The capability for Visum to interpret these models as a network or line system is a ‘first of a kind’ for the UK rail network and is an exciting opportunity to better serve our passengers, such as by minimising crowding and simplifying interchanges.”
Daniel Chaney, Senior Station Capacity Planner, Network Rail
David Aspital of PTV UK said: “Collaborating with Network Rail throughout the proof-of-concept phase of this work has been a pleasure and I’m delighted to see the tool adopted into the standard practice of station capacity planning”.

PTV. Empowering mobility.
PTV Group considère le trafic et la logistique comme un tout afin de profiter des synergies susceptibles de rendre la mobilité d’aujourd’hui adaptée aux défis de l'avenir. PTV Group propose des logiciels et des services de conseil pour préparer la mobilité et le transport de demain. Son expertise logicielle de pointe pour la gestion intelligente du trafic et l'optimisation des transports aide les décideurs des milieux politiques, urbains, industriels et commerçants à économiser du temps et de l'argent, tout en rendant les routes plus sûres et en protégeant l'environnement. PTV utilise déjà des simulations pour montrer comment la mobilité de demain peut être réalisée en tenant compte de l’ensemble de son écosystème et de son aspect pluridimensionnel. De la planification stratégique du trafic à la micromobilité sur le dernier kilomètre.
Fondée en 1979, la société compte aujourd'hui, quelque 900 employés dans le monde entier œuvrant pour des solutions d'avenir - afin que la mobilité et le transport soient plus intelligents et plus respectueux de l'environnement.
Share
Téléchargements
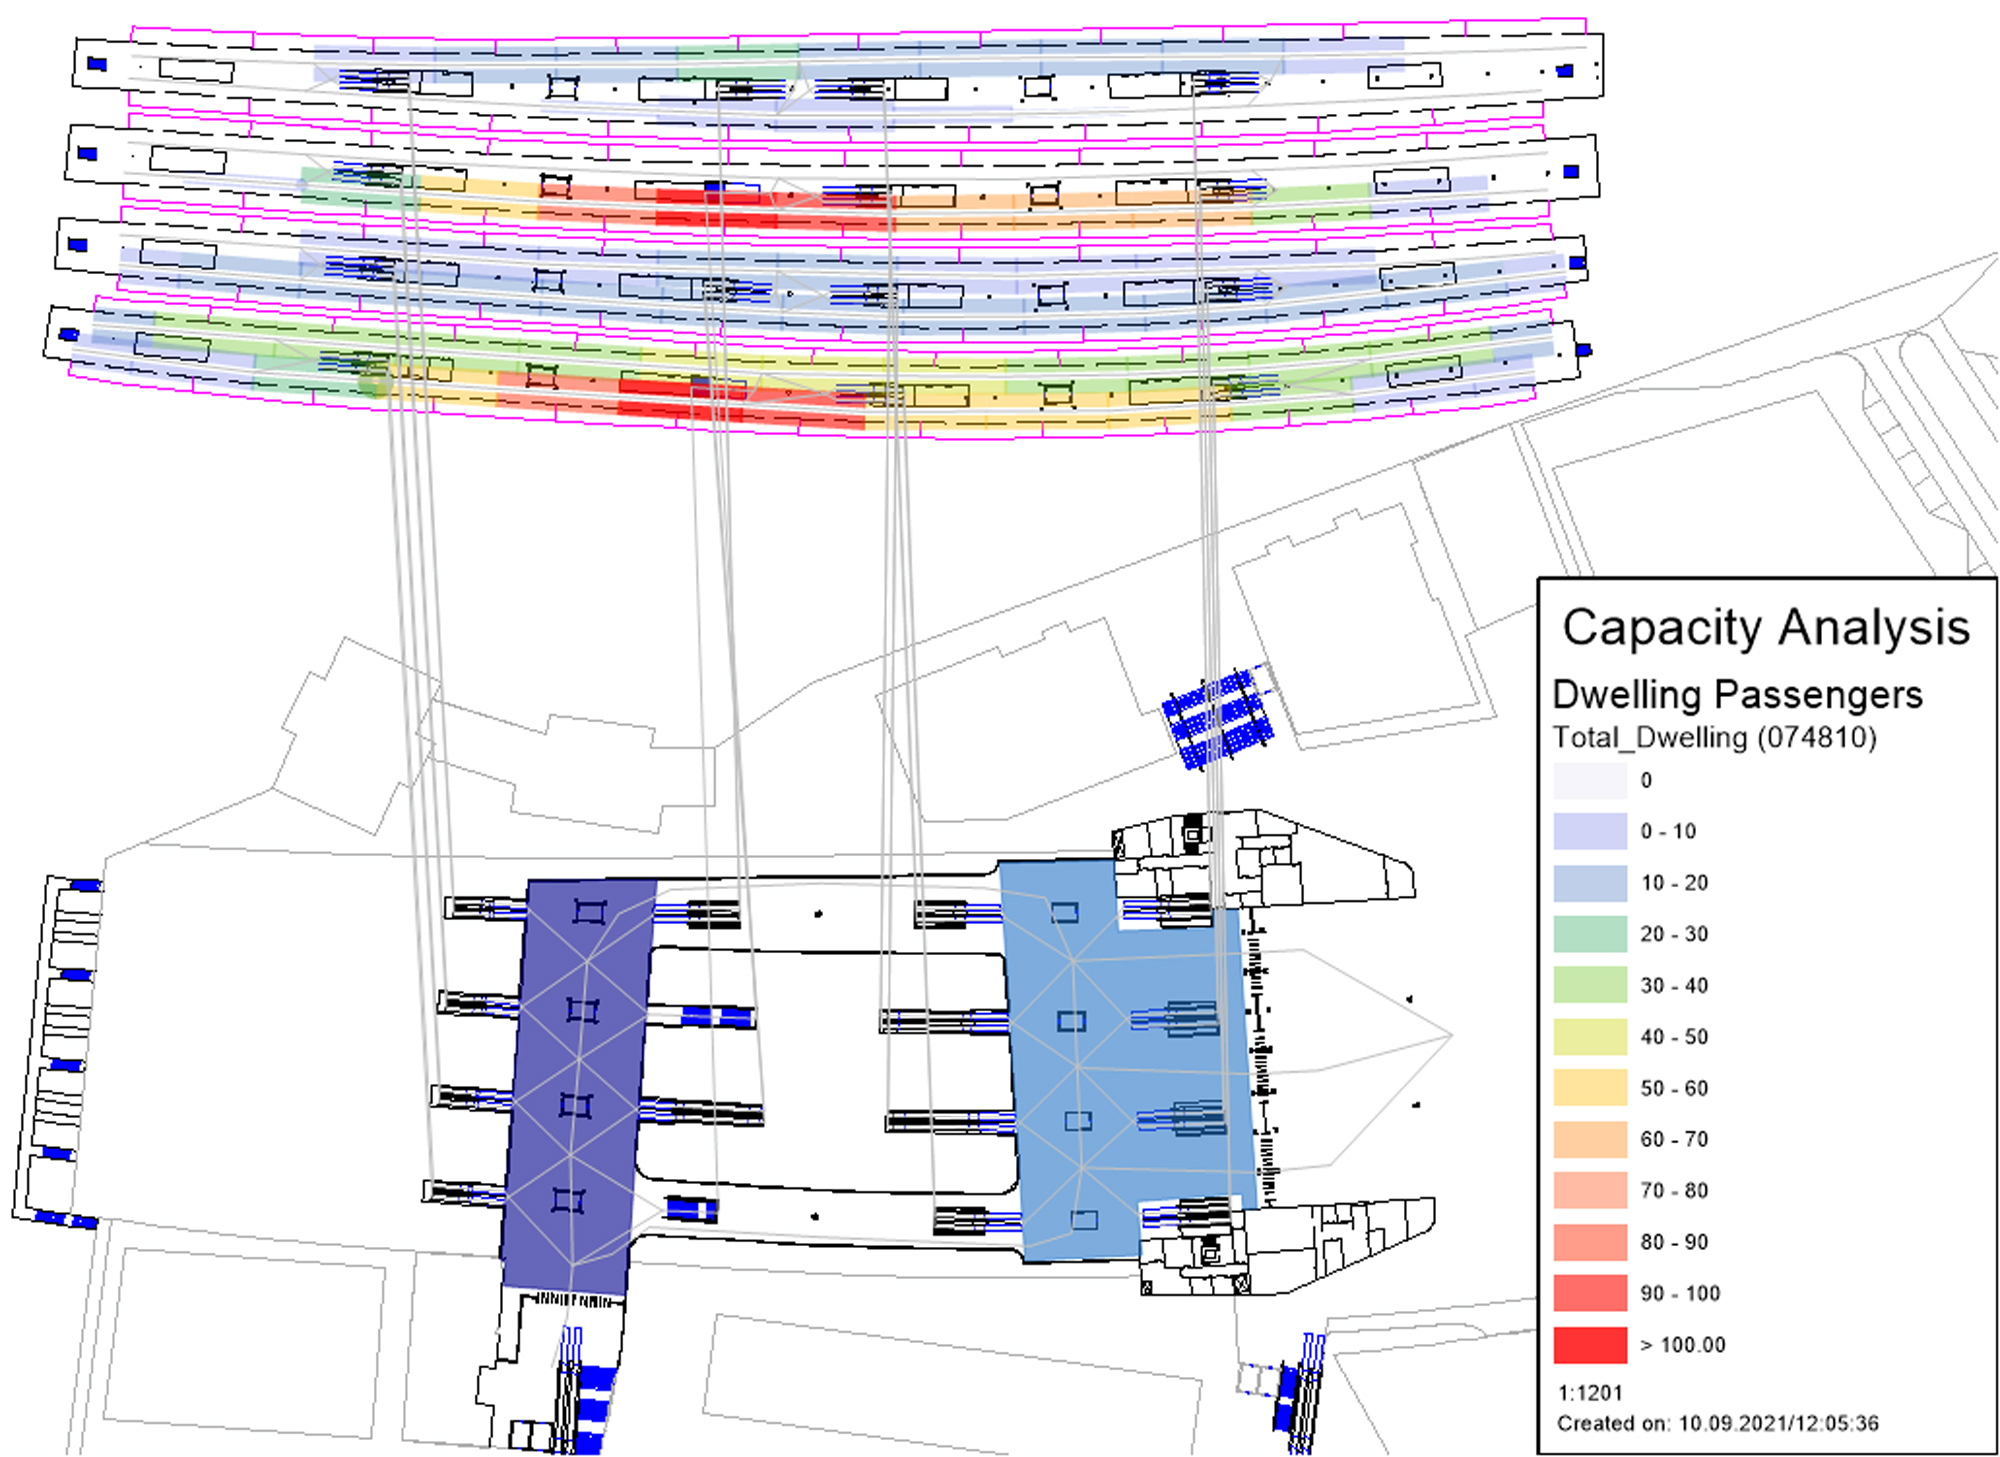
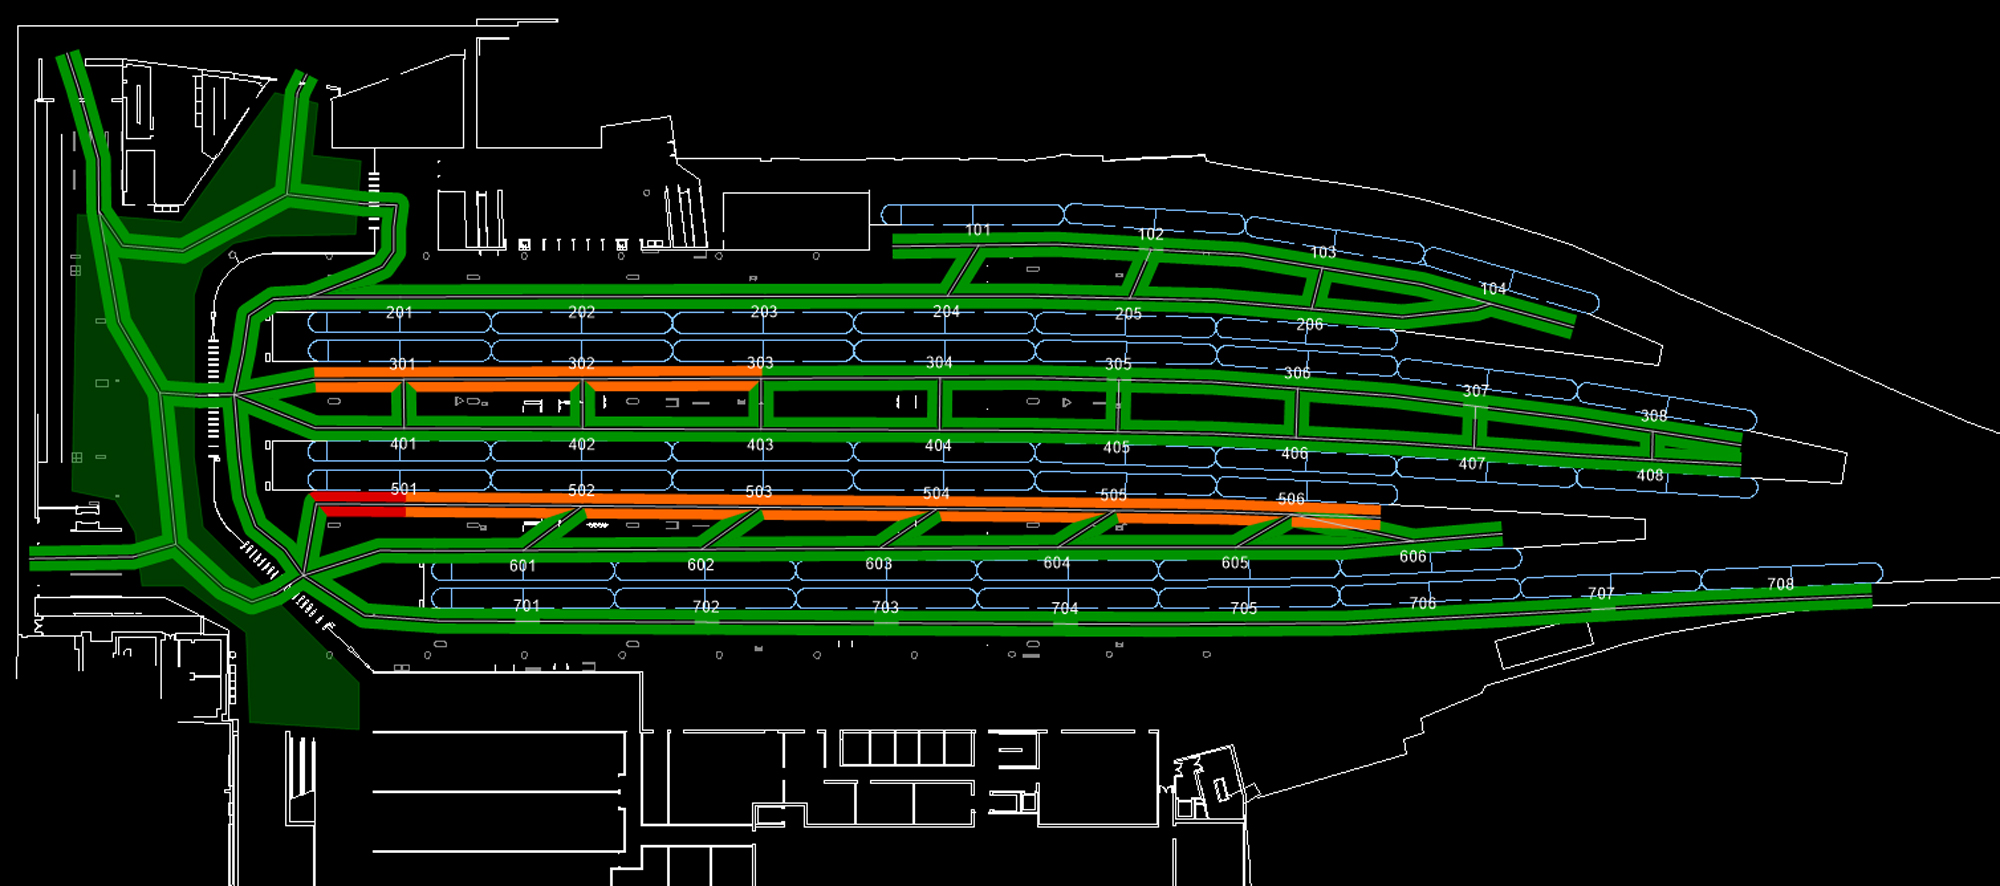
Passenger numbers derived by the tool allows for a number of scenarios and station layouts to be tested
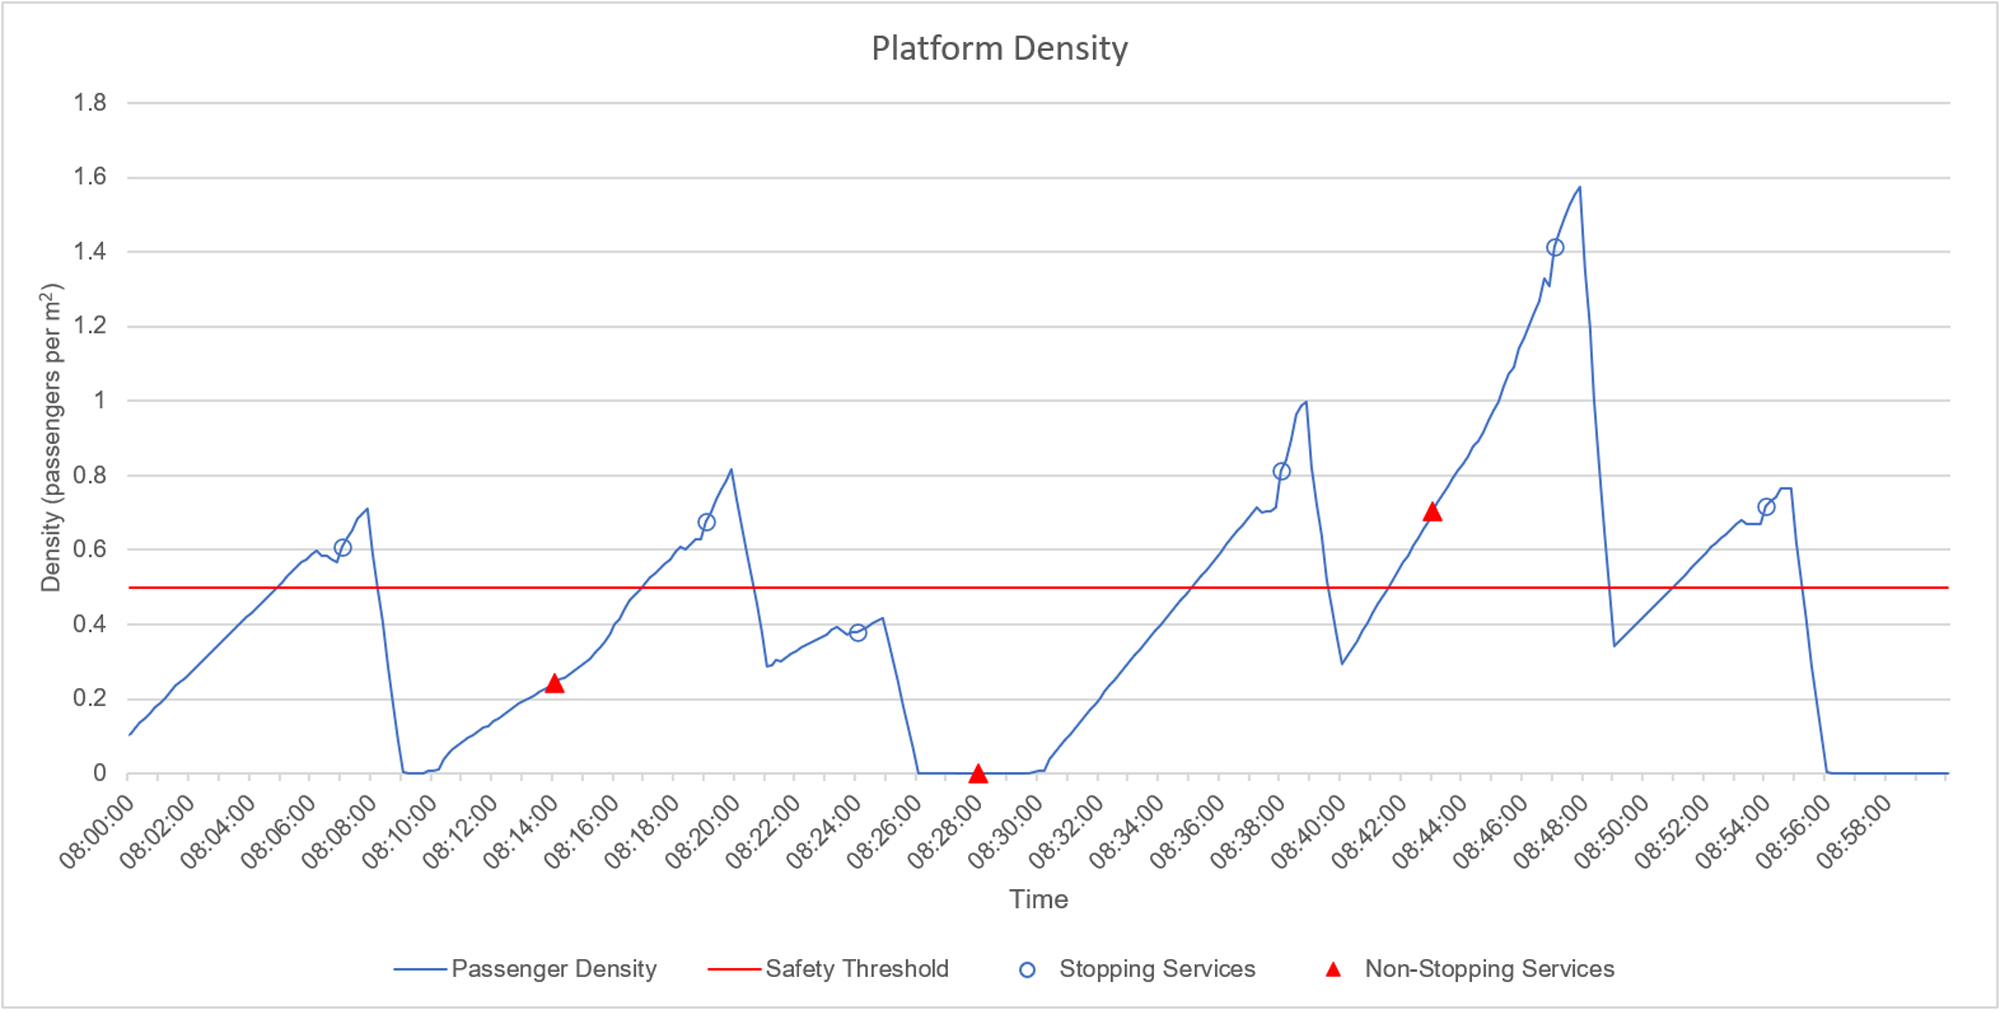
Automated export of KPIs which can be analysed for safety performance, such as crowding on the platform when a non-stopping service passes through.
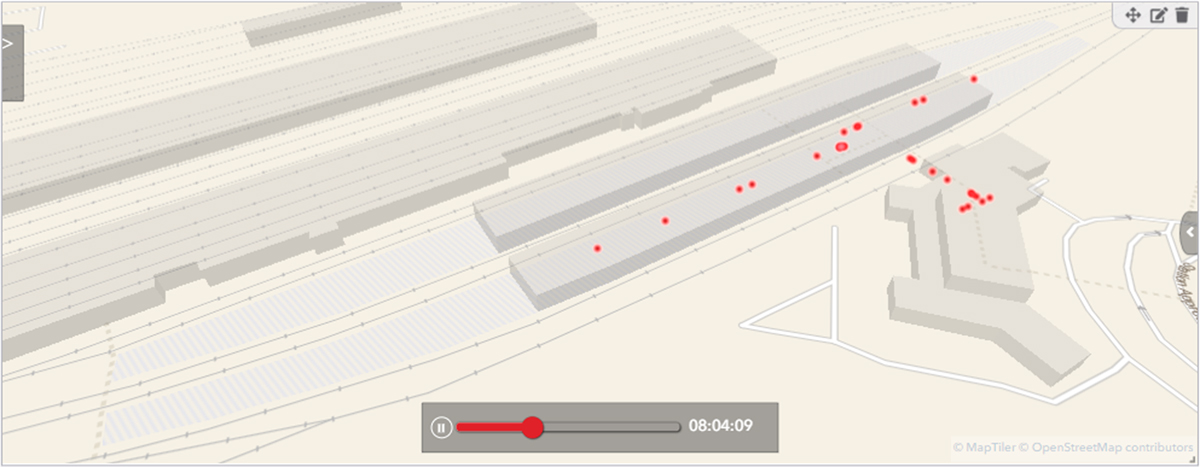
Simulation of individual passengers through the station network, taking account of conflicts and congestion.