
Empowering mobility for a cleaner, smarter & safer future
Discover our cutting-edge software solutions to optimize your mobility planning and operations.
This year’s Mobility Tech Update is available now!
Discover all the new highlights and features of PTV's and Econolite's software and hardware solutions.
Our competencies
Our goal is to drive the future of mobility toward a cleaner, smarter, and safer world. With a legacy spanning over 40 years as a leading global software company for traffic planning, simulation, and real-time management, we have garnered extensive experience in the field of mobility.
Empowering cities, municipalities, and companies to plan, model, and simulate any mobility scenario.
Powerful data, tailored to your use case, complementing our mobility software.
Germany's leading transport consultants provide expertise on any mobility project.
Boost your mobility projects with the right technology for your use case
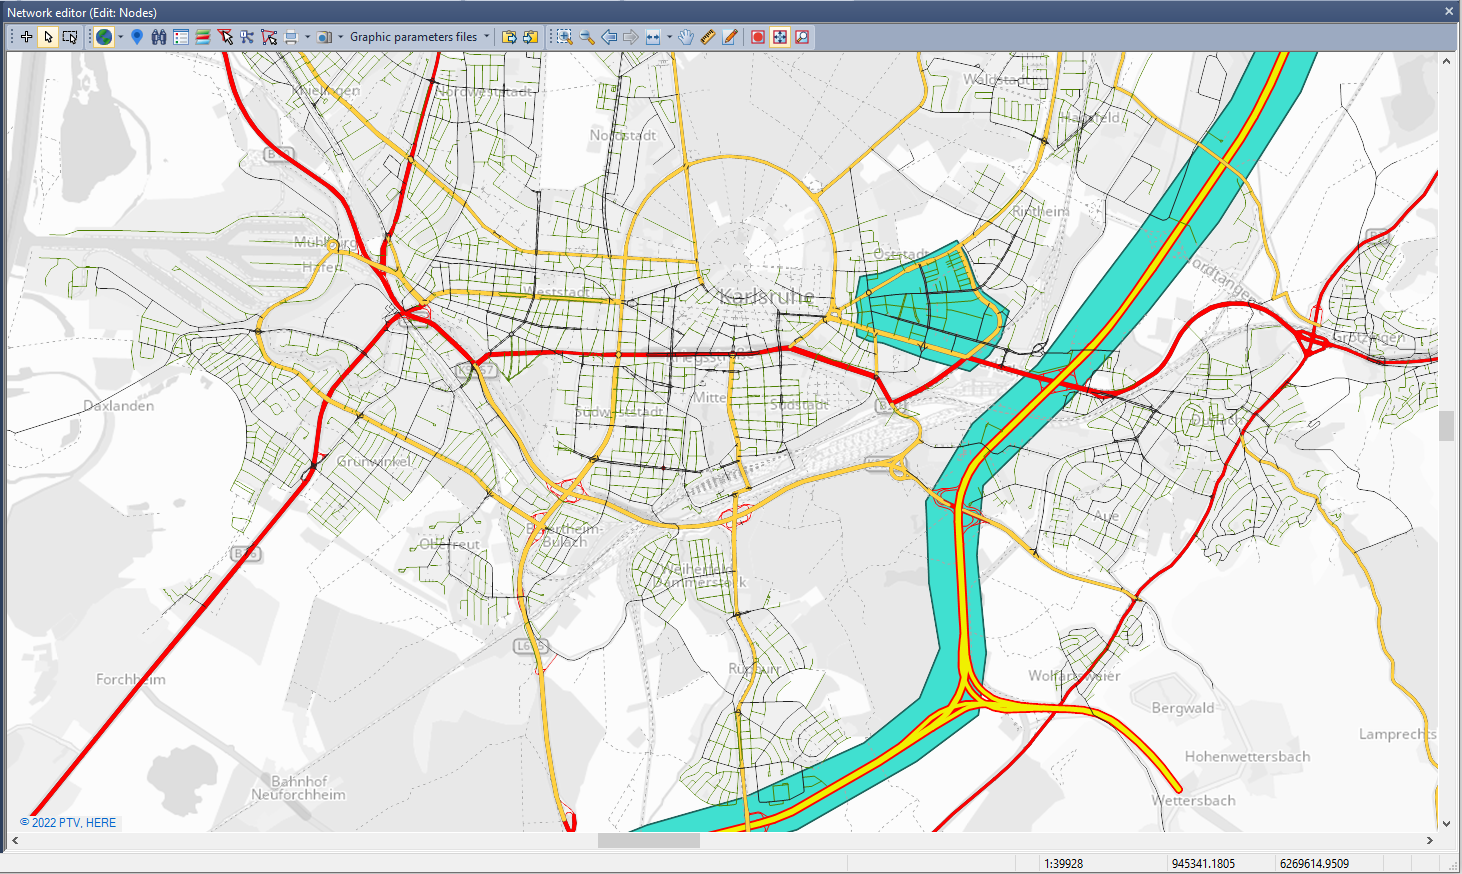
Predict
Analyze transport networks and evaluate based on accessibility and travel demand current and future mobility concepts with macroscopic modelling and simulation for long-term strategic planning and short-term operational use. Create digital twins with multimodal traffic simulation – microscopic, mesoscopic or hybrid. Forecast “what if?” scenarios supported by historical and real-time data, AI and Machine Learning and visualize your data for improved collaboration.
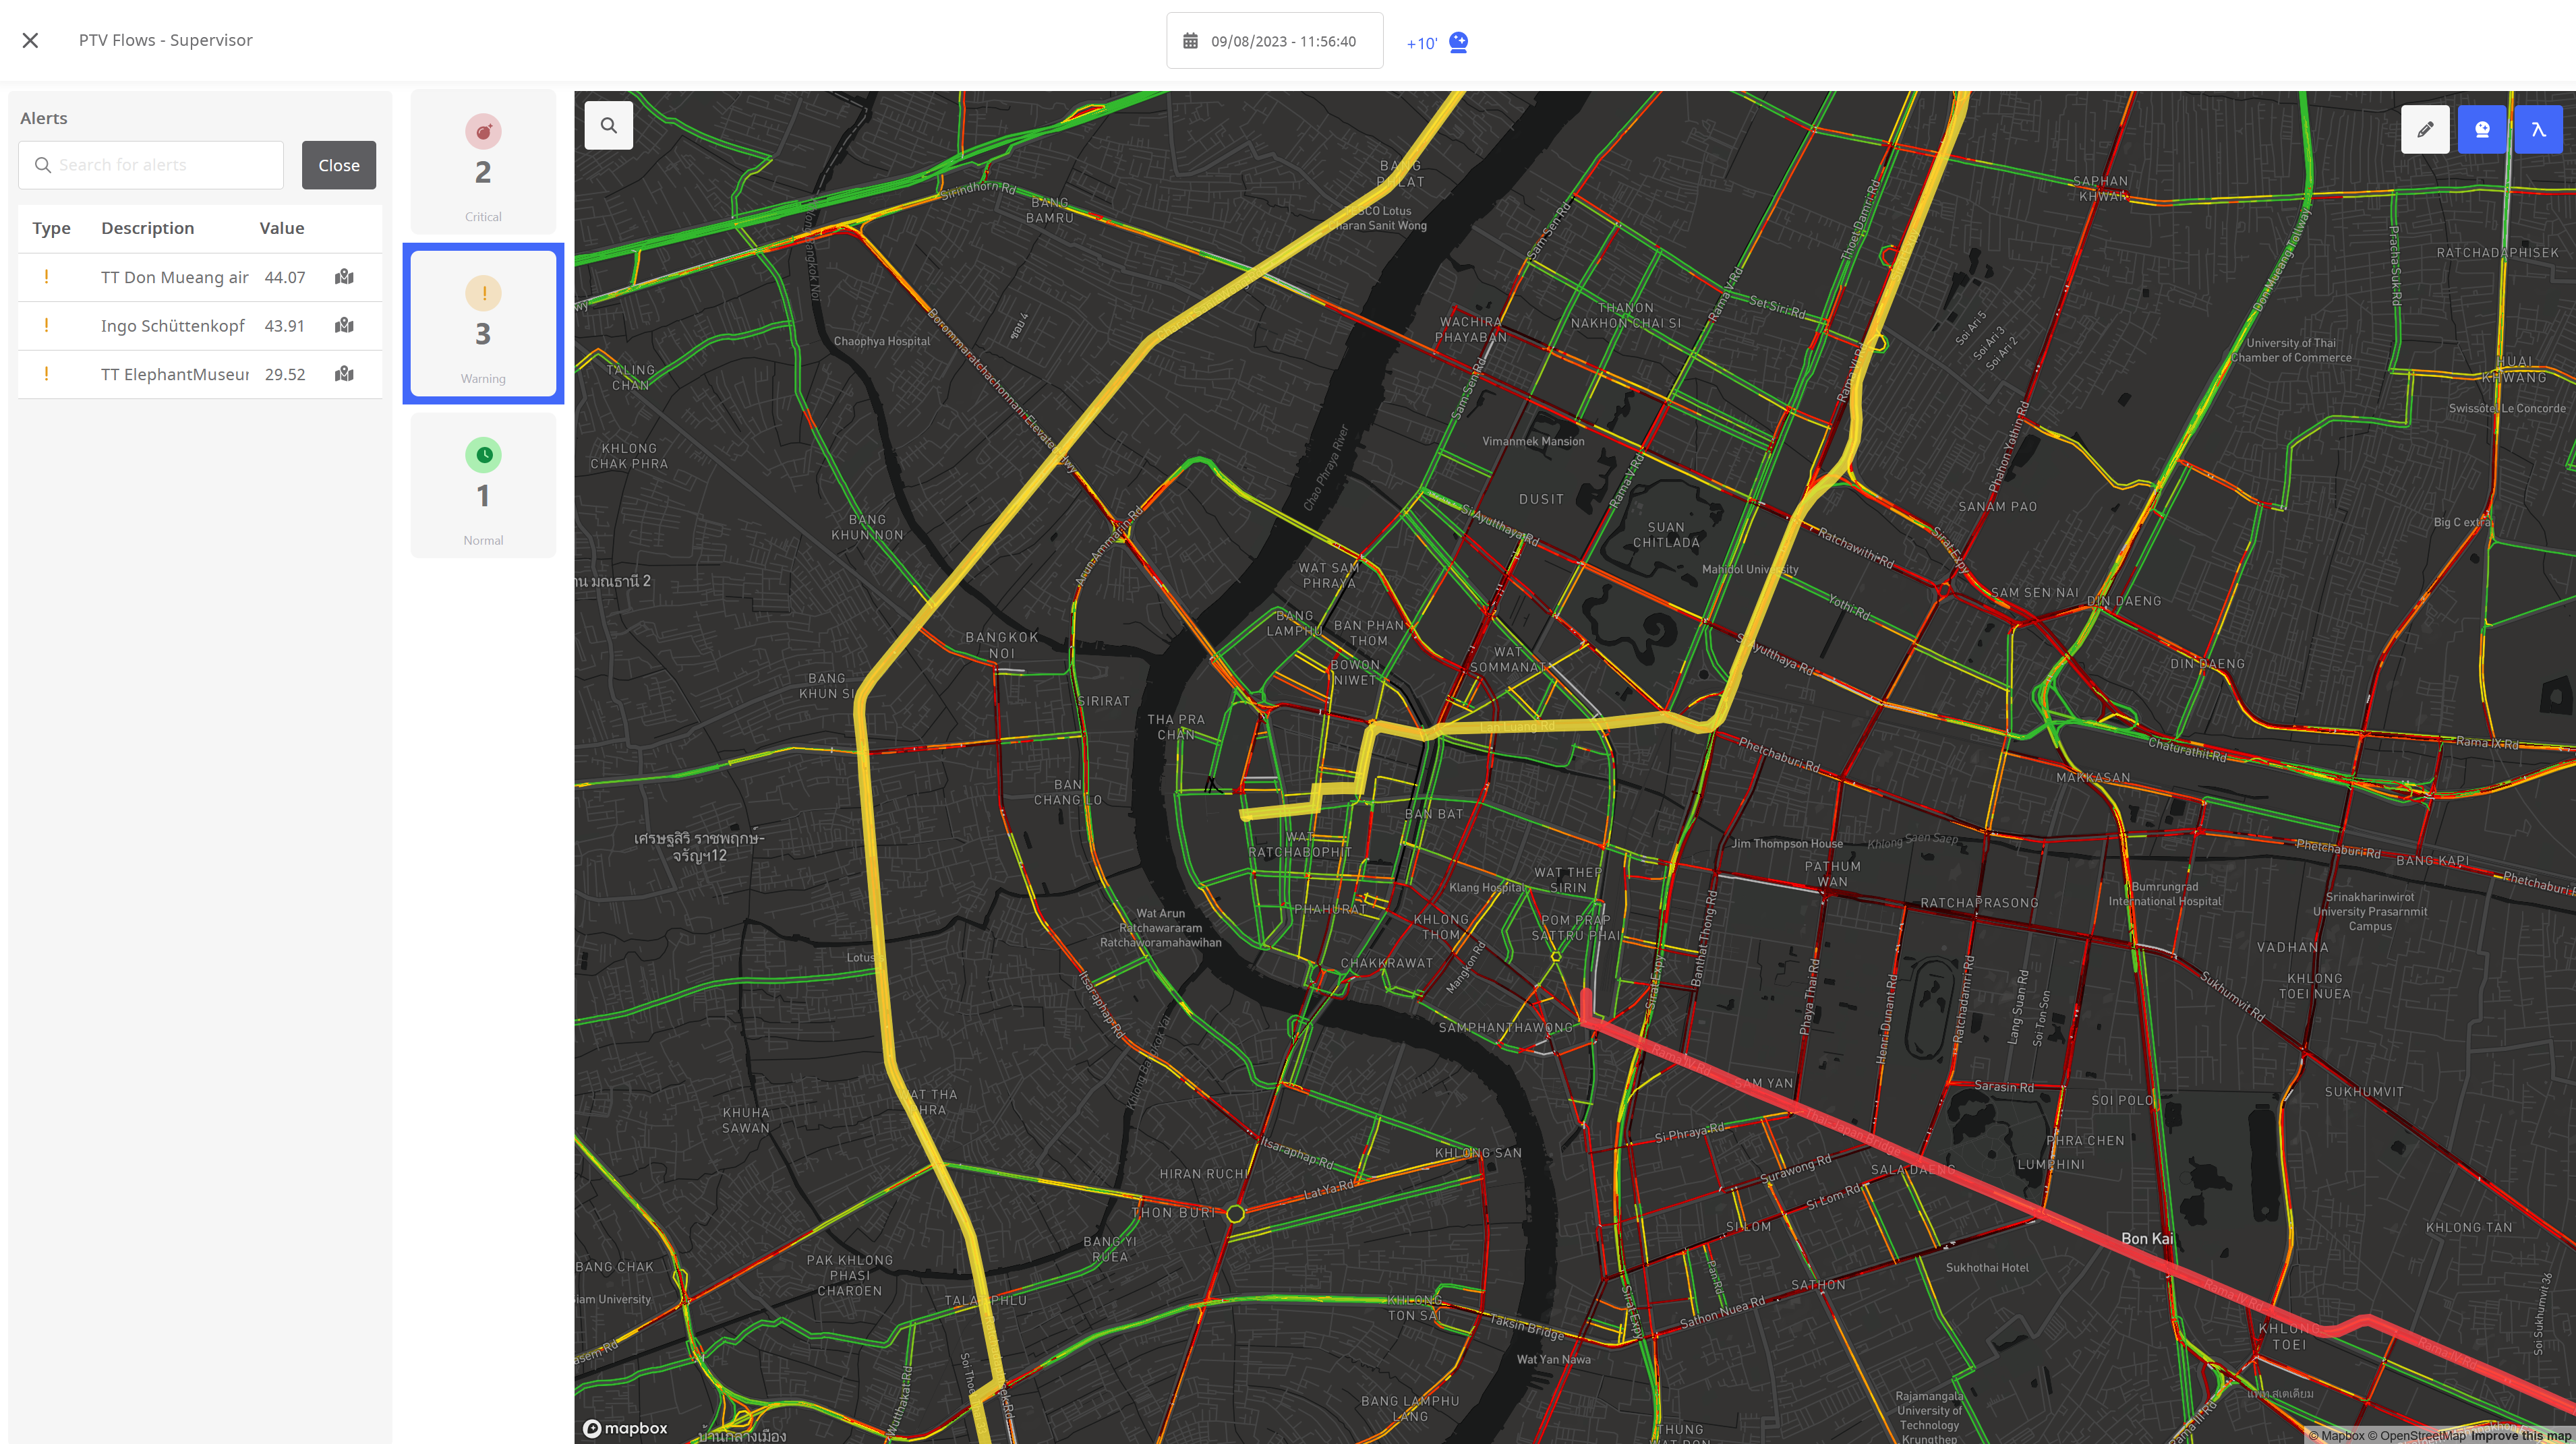
Move
Monitor your road and public transport networks, get automatic alerts and full decision support to proactively manage traffic in real-time. Let traffic flow by optimizing signalized and unsignalized intersections and roundabouts. Keep your traffic signal data synchronized between your management and modeling software to make fact-based decisions. Optimize traffic signal timings at individual intersections and across entire networks with adaptive traffic control.
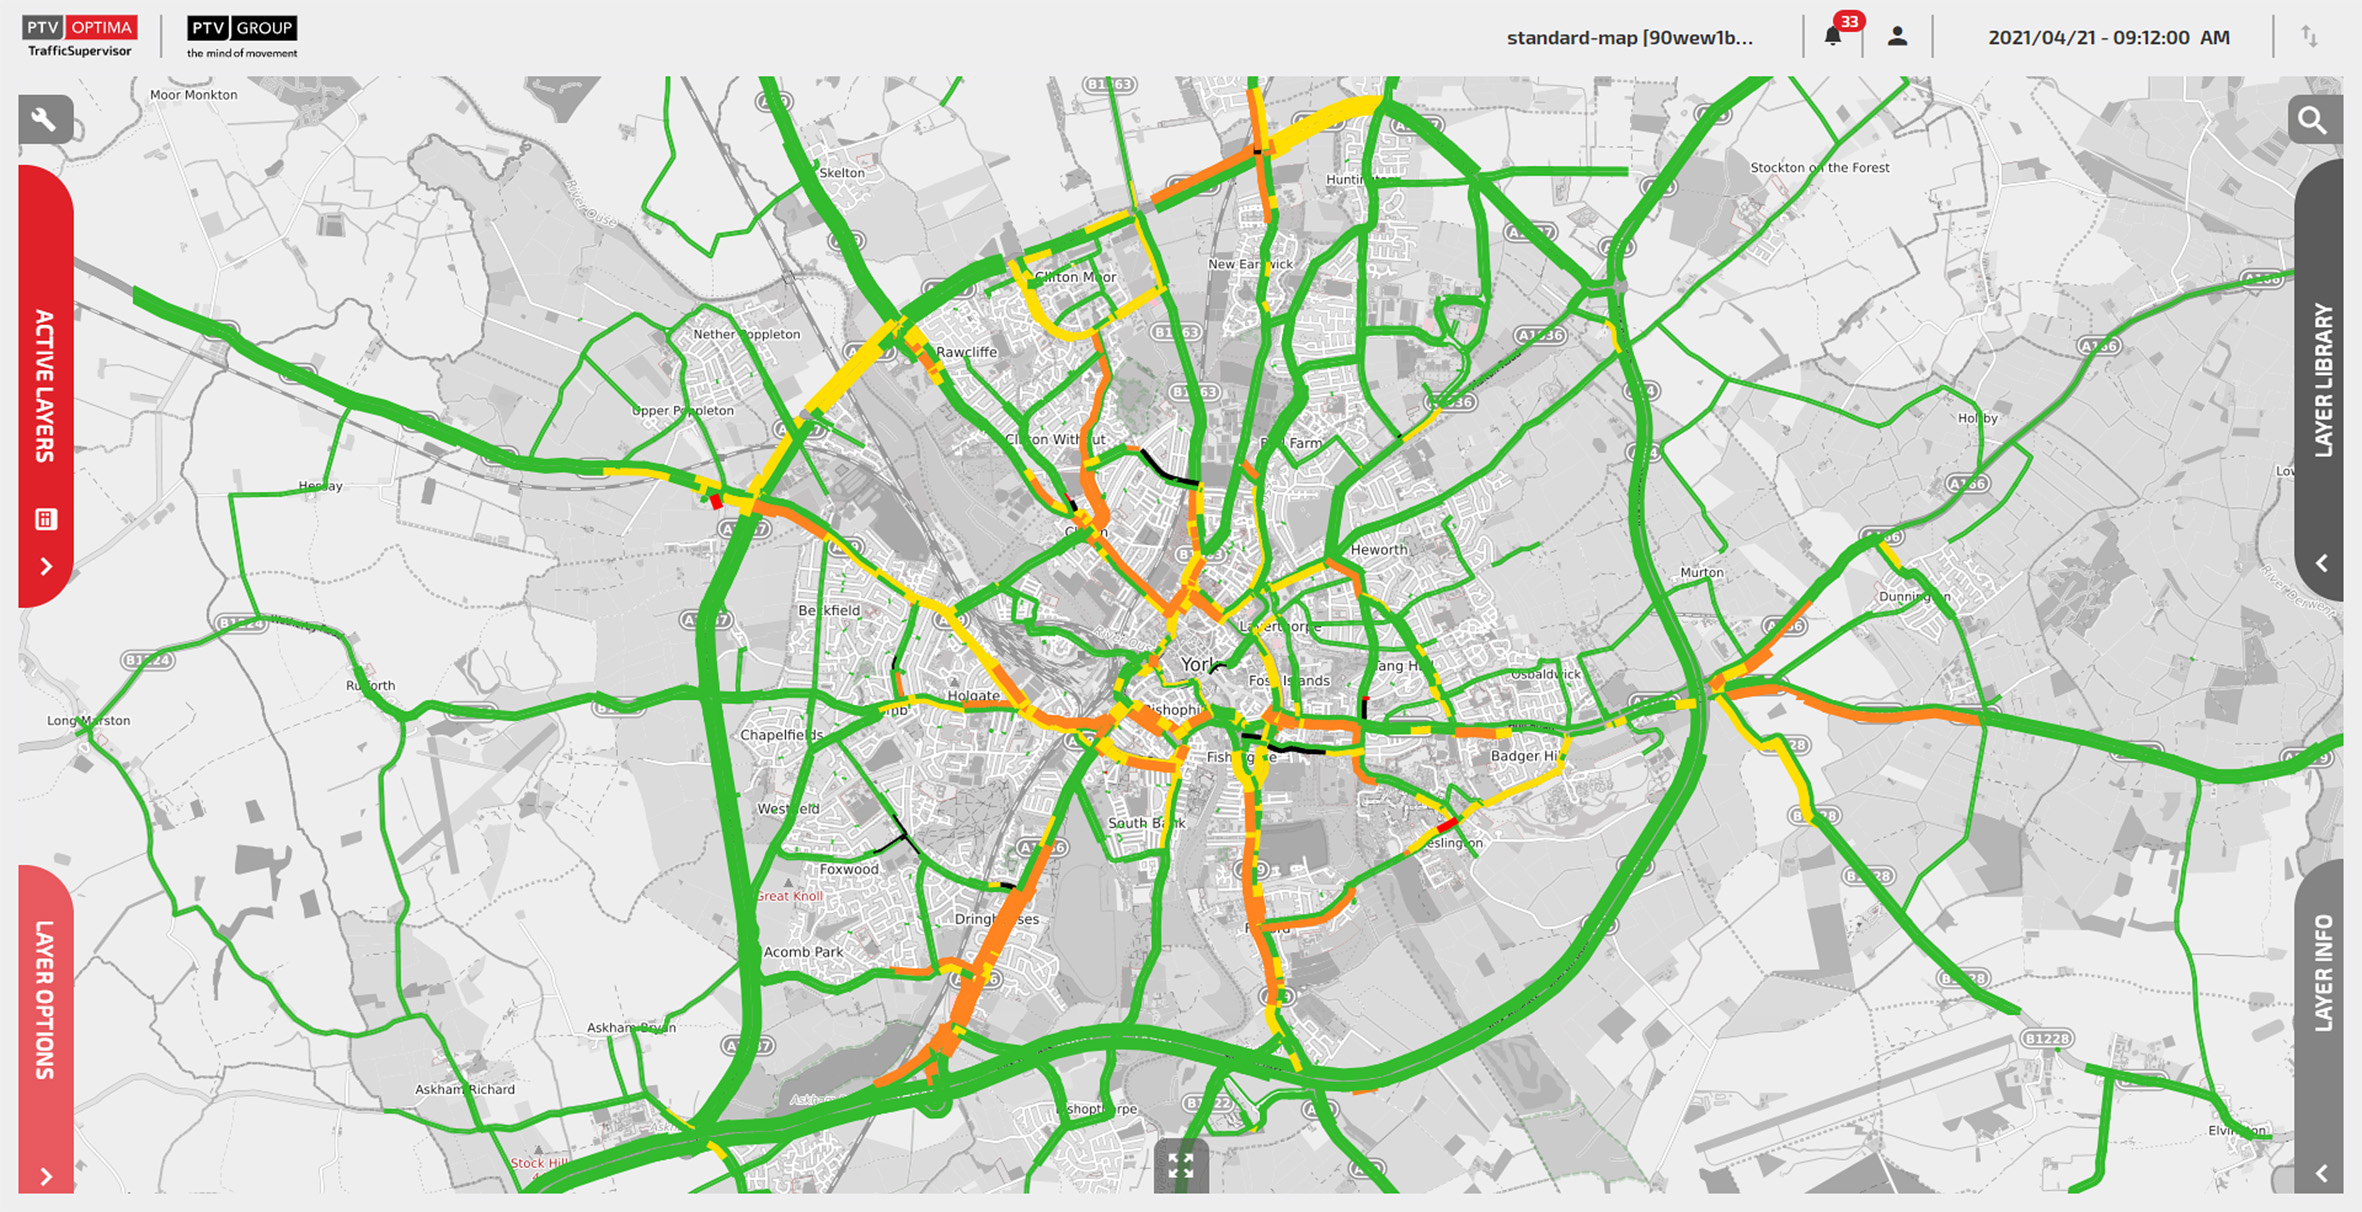
Improve
Evaluate and improve the performance of your traffic facilities and optimize your road traffic challenges, such as congestion and emissions. Decide which measure will improve your network or transit performance by balancing different KPIs. Identify issues and potential improvements leveraged by data, AI and machine learning.
Our customers
Over 2,500 cities and companies in 120 countries rely on PTV solutions
Why move forward with PTV software?
Experience and expertise
40 years of experience in traffic development, research and consulting and continuous development with our users: we innovate and grow together.
Market-leading technology
From the world’ leading transport planning & traffic simulation software PTV Visum and PTV Vissim to innovative SaaS products for specified use cases: we empower you to move forward.
The right tool for any use case
From beginners to experts, from individual products to complete packages including data and consulting: we got you covered.